The Multi Time Frame (MTF) Chart Method is a powerful analytical framework that integrates signals across multiple temporal resolutions. For institutional traders, MTF analysis is not merely a visual enhancement—it’s a tactical tool for trend validation, entry precision, and risk calibration.
Introduction: Why MTF Matters
Markets are fractal in nature. Trends and reversals manifest differently across timeframes. Institutional traders must reconcile short-term execution with long-term positioning. MTF analysis bridges this gap by aligning microstructure signals with macro context.
MTF Concept and Calculation
MTF overlays indicators from higher timeframes (HTF) onto lower timeframe (LTF) charts. This allows traders to:
Confirm short-term setups within broader trends
Avoid counter-trend trades
Time entries with reduced noise
For example, overlaying a 1-hour moving average on a 5-minute chart provides directional bias. Similarly, combining 15-min momentum with daily support zones enhances conviction.
5-min Price Action with 1-hour MA Overlay
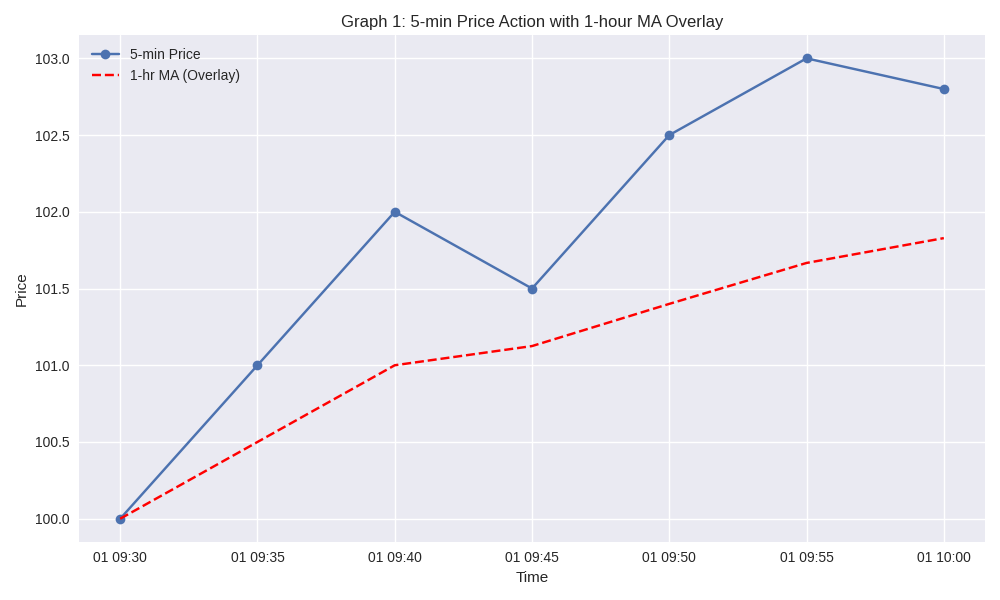
This chart illustrates how short-term price interacts with higher timeframe trend.
Click/open the card above to view the graph.
Institutional Use Cases
1. Trend Confirmation
Institutions avoid initiating trades against dominant HTF trends. MTF ensures:
5-min breakout aligns with 1-hour uptrend
15-min reversal occurs near daily support
2. Entry Timing
MTF helps refine entries:
Wait for 15-min bullish crossover within 1-hour uptrend
Use LTF pullbacks to enter HTF continuation
3. Risk Management
MTF zones define stop placement and sizing:
HTF support/resistance anchors risk
LTF volatility informs position sizing
MTF in Execution and Risk Management
Smart order execution algorithms incorporate MTF logic:
HTF filters: avoid trades during HTF consolidation
LTF triggers: execute only on LTF momentum confirmation
Dynamic risk: adjust stop-loss based on HTF volatility
Quant desks use MTF to model regime shifts and volatility clustering across timeframes.
MTF Signal Alignment
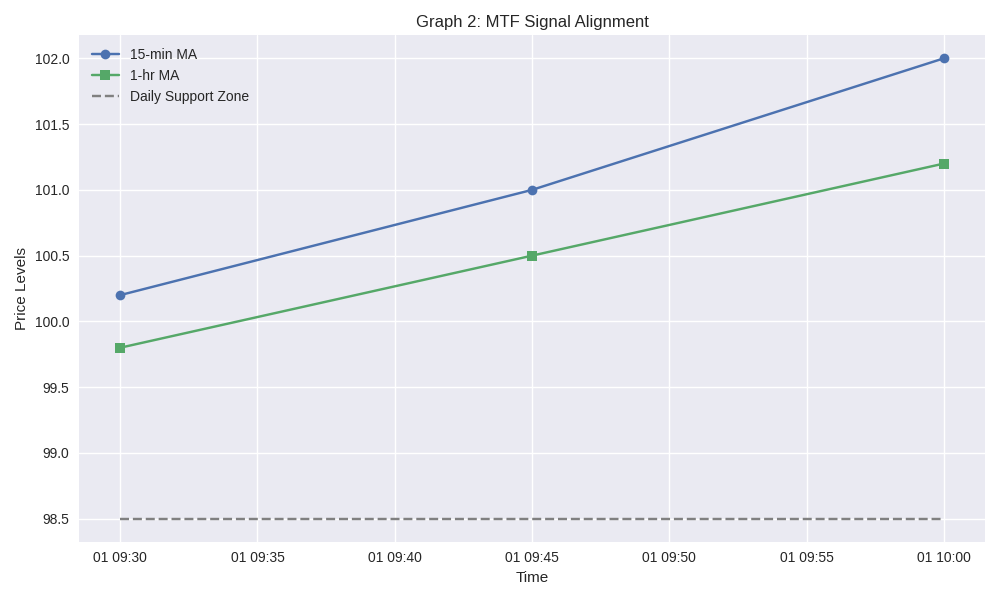
This chart shows a bullish alignment:
15-min MA crossover
1-hour trend confirmation
Daily support zone
Click/open the card above to view the graph.
Limitations and Considerations
Lag: HTF indicators may delay signal confirmation
Complexity: MTF increases cognitive and computational load
Overfitting risk: excessive MTF filters may reduce trade frequency
Conclusion
MTF analysis is indispensable for institutional traders seeking precision and context. By integrating signals across timeframes, MTF enhances trend fidelity, entry accuracy, and risk control. Whether embedded in execution algorithms or used in discretionary trading, MTF transforms fragmented data into coherent strategy.