Bitcoin Velocity
Bitcoin and US dollar velocity offer contrasting insights into monetary behavior and economic dynamics:
• Bitcoin Velocity is declining due to increased long-term holding (HODLing), reduced on-chain movement, and growing use as a store of value. Metrics like the NVT ratio and illiquid supply suggest Bitcoin is behaving more like digital gold than transactional currency.
• US M2 Velocity has also dropped significantly since the late 1990s, reaching historically low levels post-COVID. Despite rising money supply, dollars are circulating less—indicating economic stagnation, risk aversion, and asset inflation.
Key Differences:
• Bitcoin: Fixed supply, decentralized, velocity driven by speculation and conviction.
• USD: Elastic supply, centrally managed, velocity tied to GDP and consumer activity.
Strategic Implications:
• Low Bitcoin velocity may signal potential for future price surges if demand spikes.
• Low M2 velocity reflects macroeconomic caution and liquidity traps, despite asset bubbles.
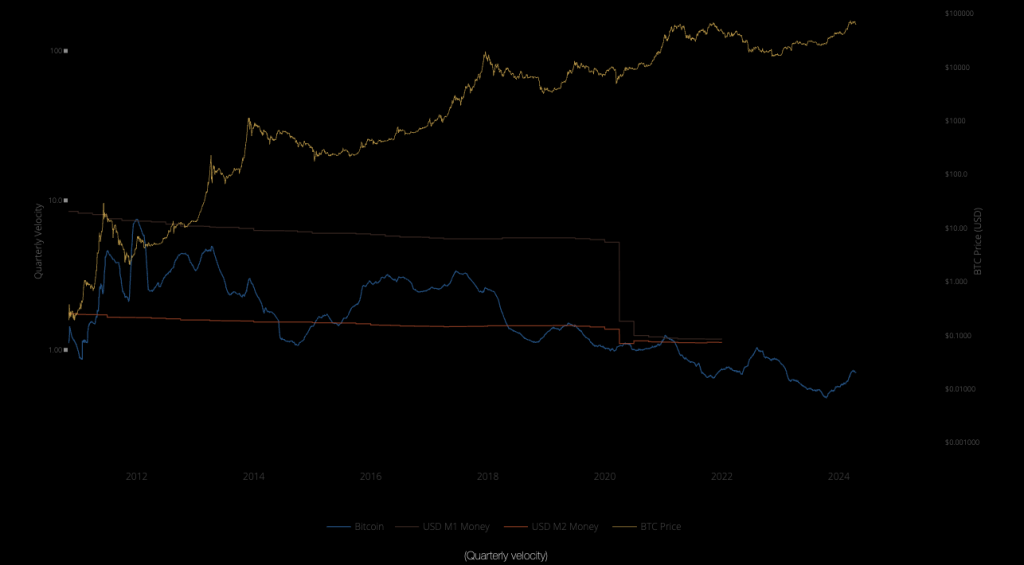
This chart compares the monetary velocity against M1 and M2 USD money stock.
Velocity is a measure of how quickly money is circulating in the economy. By plotting Bitcoin`s velocity against M1 and M2 money supply we can see whether Bitcoin use is trending towards payments or towards savings/investment.
M1 = “near cash” (typically held for short/medium term expenses)
M2 = “near cash” + “liquid non-cash assets” (majority held for longer term savings)
Bitcoin`s velocity is calculated by dividing the 90 day estimated USD transaction volume by the 90 day average USD market cap. (This is the equivalent to the $BTC circulated divided by the Bitcoin money supply.)